
CACL Letter 2004-003
The data compiled and analyzed for this update is based on communication between the Department of Pesticide Regulation (DPR) staff and county agricultural commissioners (CACs) and their staff. A lack of contact with some CACs may have resulted in incomplete information, but it is hoped that all records can be brought up to date for the revised version of this report.
- 45 CACs have GIS.
- 34 CACs have some or all field borders mapped.
- 18 CACs are maintaining field border data annually.
- 21 CACs are using ArcGIS version 8x or above
- 24 CACs are using ArcView 3x only.
- 24 CACs have submitted their most recent field border databases for this report. These counties are: Butte, El Dorado, Fresno, Glenn, Imperial, Kern, Kings, Madera, Marin, Merced, Napa, Sacramento, San Joaquin, San Luis Obispo, Santa Barbara, Santa Clara, Santa Cruz, Solano, Sonoma, Stanislaus, Sutter, Ventura, Yolo, Yuba.
- 175,979 sites (polygons) have been mapped by the counties listed in item 6.
- Unfilled requests for field border data are pending for Amador, Colusa, Mendocino, Monterey, San Diego and Shasta.
- It’s estimated that about 30,000 sites may have been mapped by the counties listed in item 8.
Observations:
- Due to fiscal constraints, Fresno (2001), Merced (2002), Napa (2003), and Sacramento 2002) are unable to maintain their completed field border databases. Although field border polygons are in place for these counties; changes to commodities, pesticide use, and field boundaries have not been updated since the year indicated in parentheses – significantly reducing the value of the data.
- Four CACs (Glenn, Solano, Yuba, and El Dorado) are using Glenn County’s permit mapping application to maintain their spatial and Dataflex data. The Glenn County permit mapping application gives CACs the ability to map and maintain both spatial and Dataflex data through a simple map-based user interface. Glenn County has reduced the amount of time required to issue permits by roughly 30 percent, thus reducing the amount of time required for the grower to be in the office, and providing a professional, more accurate representation of the grower’s operated property. In addition, Glenn County staff have been able to reduce the time required for all pesticide related field inspections by roughly 30 percent; can quickly find the operator of any given field in county without the need to research the old maps found in permit files; and can take advantage of the visual representation of potential hazards to pesticides while issuing permit with the grower.
- Most of the prime agricultural areas of California are now mapped. Noticeable omissions are Tulare, Riverside, Tehama, Humboldt, Del Norte and portions of Plumas, Contra Costa, and Alameda counties.
Table 1.
Summarizes the status of GIS in each county. The following information is provided:
- Does the CAC have a program? Yes or No.
- What is the Status of the development of field borders in each county?
- NO GIS – NO GIS software or program exists.
- NO DATA – the CAC has GIS which is being used for other programs such as Weed Mapping or Pest Detection, but Pesticide Use field border data have been developed.
- DEVELOPMENT – The CAC is in the process of digitizing and attributing a spatial field border database.
- COMPLETE – The CAC has completed the process of digitizing and attributing a spatial field border database, but the data are not maintained on an annual basis.
- MAINTAINED – The CAC has completed the process of digitizing and attributing a spatial field border database and maintains the data annually.
- What is the approximate percentage of the field borders that have been digitized?
- What version of ArcView is the CAC using? ArcView GIS 3.x, ArcGIS 8.x or 9x, or both versions?
- How current is the field border data provided to DPR for this report? Most CACs have provided a copy of their most current dataset, with the exception of Amador, Colusa, Lake, Mendocino, Monterey, Nevada, San Diego and Shasta. It should be noted that the field border database does not need to be complete to be included in this report. The information collected reflects a snapshot of the current status.
- Number of Sites? This is a count of the number of sites that have been digitized, i.e., the number of polygons in the field border database shapefile.
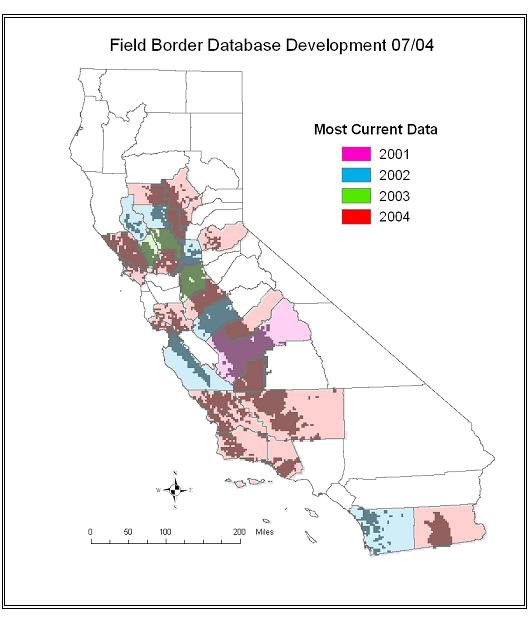
Figure 1.
Shows the extent of field border data development by the CACs. Colors are used to represent the most current data provided by each CAC. “Grey” areas within each county show the geographical extent of the field borders, and have been derived from each CAC’s actual data.
I ask that those counties who have not provided the data please contact Ada Ann Scott at ascott@cdpr.ca.gov, and Rosemary Neal at rneal@cdpr.ca.gov, with a copy to me at dmerkley@cdpr.ca.gov just to let us know what we might be able to do to address any concerns, or issues you may have that has prevented you from forwarding the data.
Sincerely,